


What's Really Happening in the Austin Housing Market.
Data without spin. Context without guesswork. I track the numbers so you can make smart moves.
Cedar Park Market at a Glance
This section features up-to-date stats directly from the MLS. It’s updated in real time, so you always have the most current view of what’s happening across Cedar Park, TX.
Cedar Park Real Estate
Market Snapshot
Second Quarter Report (June 30)
All Information Courtesy of UnlockMLS and subject to UnlockMLS copyrights
The Austin-area housing market is showing signs of balance after a few turbulent years. Here's what the data is telling us:
Price Stability with Room for Opportunity
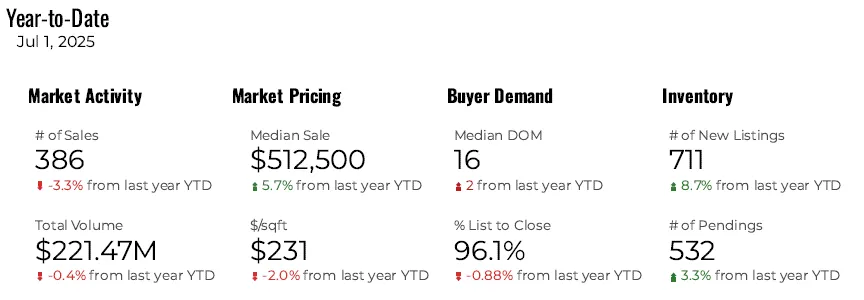
The median sales price in the City of Cedar Park was $512,500 in May 2025: up 5.7% year-over-year, signaling a stabilization in prices after the drop we saw from 2022 highs. Across the five-county region, the median price sits at $460,000, down 1% from last year. This shift opens up opportunities for well-qualified buyers and strategic sellers alike.
Inventory on the Rise
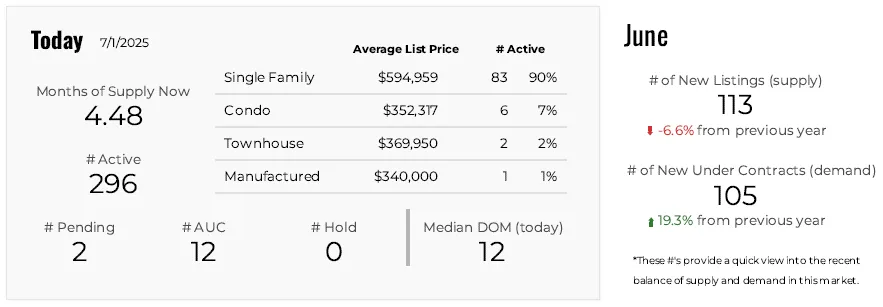
Active listings across the region rose nearly 40% year-over-year. In Cedar Park, we’re seeing 4.48 months of inventory, giving buyers more choices and creating room for negotiation. It’s no longer the feeding frenzy of 2021, but homes that are well-presented and properly priced are still moving.
Homes Are Still Selling - If Positioned Right
While average days on market have ticked up (hovering around 60 days across Central Texas), closed sales are down 3.3% from last year-to-date, but pending sales are up 3.3%. This provides proof that serious buyers are still out there. The key? Smart pricing and professional strategy.
What This Means for You
Whether you're buying or selling, this isn't a one-size-fits-all market. The gap between homes that sit and homes that sell is wider than ever - and it’s all about strategy. You don’t need hype. You need a plan.
Cedar Park Real Estate Market Snapshot
Second Quarter Report (June 30)
All Information Courtesy of UnlockMLS and subject to UnlockMLS copyrights
The Austin-area housing market is showing signs of balance after a few turbulent years. Here's what the data is telling us:
Price Stability with Room for Opportunity
The median sales price in the City of Cedar Park was $512,500 in May 2025: up 5.7% year-over-year, signaling a stabilization in prices after the drop we saw from 2022 highs. Across the five-county region, the median price sits at $460,000, down 1% from last year. This shift opens up opportunities for well-qualified buyers and strategic sellers alike.
Inventory on the Rise
Active listings across the region rose nearly 40% year-over-year. In Cedar Park, we’re seeing 4.48 months of inventory, giving buyers more choices and creating room for negotiation. It’s no longer the feeding frenzy of 2021, but homes that are well-presented and properly priced are still moving.
Homes Are Still Selling - If Positioned Right
While average days on market have ticked up (hovering around 60 days across Central Texas), closed sales are down 3.3% from last year-to-date, but pending sales are up 3.3%. This provides proof that serious buyers are still out there. The key? Smart pricing and professional strategy.
What This Means for You
Whether you're buying or selling, this isn't a one-size-fits-all market. The gap between homes that sit and homes that sell is wider than ever - and it’s all about strategy. You don’t need hype. You need a plan.
It’s Not Just Data. It’s Strategy Fuel.
Whether you're buying or selling, understanding the market helps you time things right, price strategically, and negotiate with confidence. Here’s what today’s numbers mean:
For Sellers: Demand has shifted. Pricing correctly upfront matters more than ever. Let’s talk comps and positioning.
For Buyers: More inventory may mean more leverage. But not all price drops are bargains. I’ll help you read between the lines.
It’s Not Just Data.
It’s Strategy Fuel.
Whether you're buying or selling, understanding the market helps you time things right, price strategically, and negotiate with confidence. Here’s what today’s numbers mean:
For Sellers: Demand has shifted. Pricing correctly upfront matters more than ever. Let’s talk comps and positioning.
For Buyers: More inventory may mean more leverage. But not all price drops are bargains. I’ll help you read between the lines.
How We Got Here
Real estate moves in cycles, and Austin has a rhythm of its own. I’ve tracked local market trends for over two decades, and I regularly compile key data points to give my clients historical perspective.
Below, you’ll find snapshots of annual appreciation, average sales price, and market dips and recoveries.
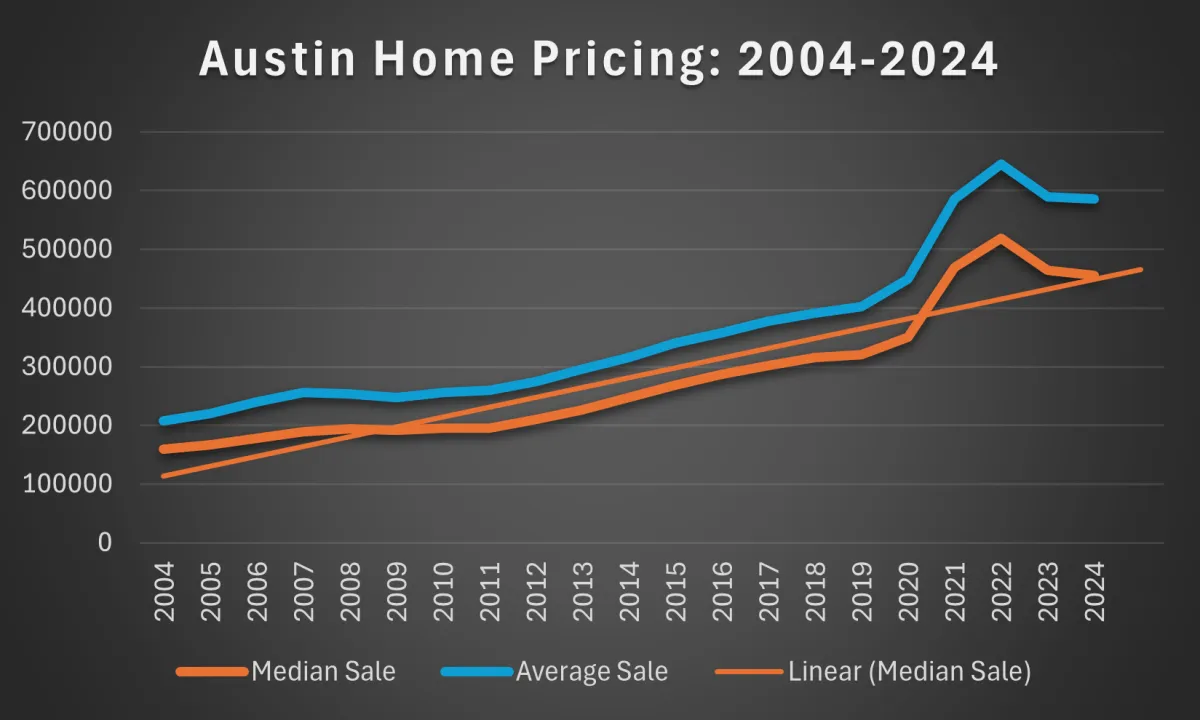
Over the past 20 years, the average annual price appreciation in the Austin MSA has hovered around 5-6%, significantly outpacing the national average. While there have been bumps along the way, the long-term trajectory is up.
A Look Back
Austin's Persistent Real Estate Cycle
In the 1990s, Dr. Stephen Phyrr, then a professor and real estate investor in Austin, published a landmark article titled Austin's Persistent Real Estate Cycle. In it, he charted the rise, fall and recovery of Austin's real estate market going back to the 1970s, and predicted the market's pattern of 7-10 year cycles - from boom to bust to robust.
His forecast proved prescient. Austin's history since then has reflected that pattern again and again: rapid growth, overheated prices, correction, stabilization, and rebound.


How We Got Here
Real estate moves in cycles, and Austin has a rhythm of its own. I’ve tracked local market trends for over two decades, and I regularly compile key data points to give my clients historical perspective.
Below, you’ll find snapshots of annual appreciation, average sales price, and market dips and recoveries.
Over the past 20 years, the average annual price appreciation in the Austin MSA has hovered around 5-6%, significantly outpacing the national average. While there have been bumps along the way, the long-term trajectory is up.
A Look Back
Austin's Persistent Real Estate Cycle
In the 1990s, Dr. Stephen Phyrr, then a professor and real estate investor in Austin, published a landmark article titled Austin's Persistent Real Estate Cycle. In it, he charted the rise, fall and recovery of Austin's real estate market going back to the 1970s, and predicted the market's pattern of 7-10 year cycles - from boom to bust to robust.
His forecast proved prescient. Austin's history since then has reflected that pattern again and again: rapid growth, overheated prices, correction, stabilization, and rebound.


Get Local + National Market Updates
Want Monthly Market Updates? Delivered Right to Your Inbox
Each month, I break down what’s happening in Austin real estate - plus major national trends, interest rate shifts, and what it means for you.
It’s quick, actionable, and actually helpful.
JAMES BRINKMAN (BRINK)
Broker | Realtor | CNE | CRS | ABR | ePro
Homes By Brink @ AustinRealEstate.com
512-698-3525
Brink@HomesByBrink.com
James Brinkman – Broker, Realtor, SRES, CRS, CNE | Homes By Brink
3103 Bee Caves Rd STE 102, Rollingwood, TX 78746
(512) 698-3525
Homes by Brink | Copyright © 2025 | All Rights Reserved
Privacy Policy l Terms & Condition|Disclosure

Homes By Brink
Homes by Brink | Copyright © 2025 | All Rights Reserved
Privacy Policy l Terms & Condition|Disclosure