What the 78729 North Austin Housing Market Means for Buyers and Sellers (2026 Update)
If you are researching the 78729 housing market, you are looking at one of the most practical value zip codes in North Austin. This is Milwood, Rattan Creek, Hunters Chase, Village at Anderson Mill, and the pockets around them: 1980s and 1990s subdivisions built for families and tech workers, wedged between Parmer Lane and US 183, with Round Rock ISD schools and a price point that still lets a dual-income household buy a real single-family house. It does not carry the name recognition of Great Hills or the price tags of 78750, and that is exactly why buyers keep circling back to it.
Here is what the 78729 market actually looks like heading into the fall of 2026, what the numbers mean if you are buying or selling, and where the honest tradeoffs are. All the local figures below come from the ABoR/Texas Real Estate Research Center zip-detail data; the rate and metro backdrop are verified as of late September 2026.
The number that matters most in 78729 right now
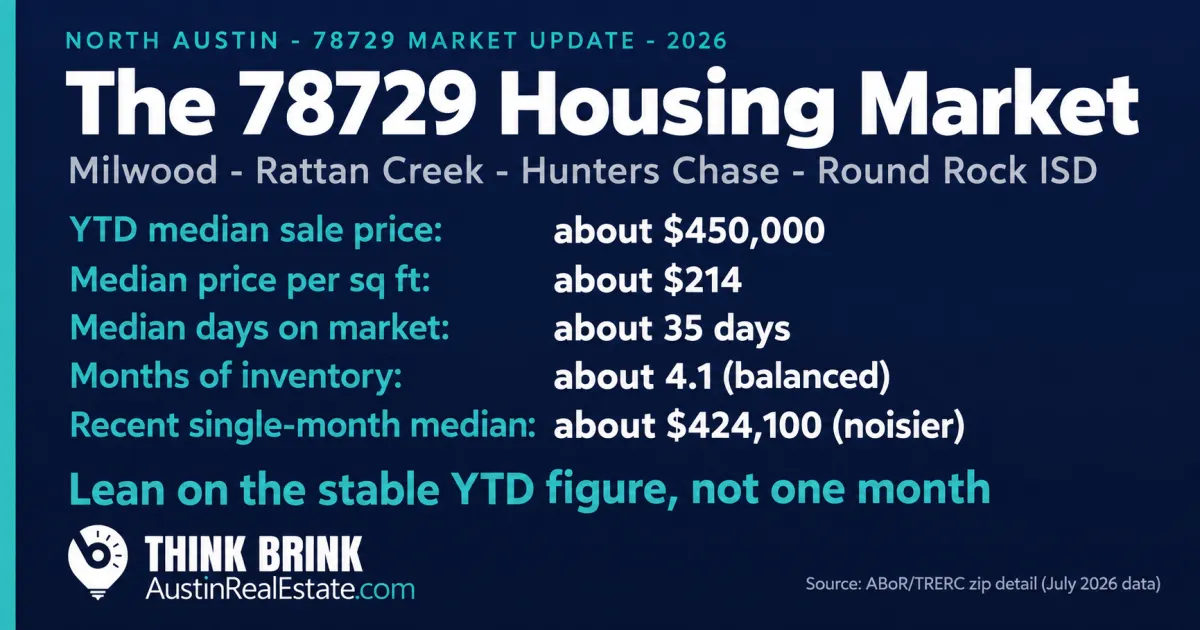
The stable figure to anchor on is the year-to-date median sale price of about $450,000, at roughly $214 per square foot. That is the number I would quote a buyer or seller first, because it smooths out the month-to-month swings that a single low-volume month can produce.
For context, the most recent single-month median came in around $424,100. That is lower than the year-to-date figure, and it would be a mistake to read it as a sudden drop. In a zip like 78729, one month's median mostly reflects which homes happened to close that month, not a change in what your specific house is worth. A month heavy on smaller Hunters Chase homes pulls the median down; a month with more updated Rattan Creek two-stories pulls it up. Lead with the year-to-date number, and use the single month only to read the direction and the pace.
What the two figures together tell you is real, though: 78729 is a mid-$400s market on a price-per-square-foot basis that is meaningfully below the core Northwest Austin zips. Where 78759 runs well over $300 per square foot and 78750 sits around $290, 78729 is closer to $214. You are buying square footage and a yard here, not a prestige address, and for a lot of buyers that is the entire point.
How fast homes are selling, and how much leverage each side has
Median days on market in 78729 has been running around 35, with roughly 4.1 months of inventory. Both numbers describe a balanced, mildly buyer-favorable market. Homes are selling in about five weeks on average, not five days, and there is enough standing inventory that buyers have time to see a house twice, order an inspection, and negotiate rather than waive everything to win.
That is a very different market than 2021 and 2022, when anything under $500,000 in this corridor drew multiple offers over the weekend. It is also not a crash. Four months of inventory is close to what real estate has historically called a normal, functioning market. The practical read: a well-priced, well-prepared 78729 home in good condition still sells in a reasonable window, but a home that is overpriced or shows poorly now sits, and sitting is what forces price cuts.
For buyers, the leverage shows up in small but real ways: you can ask for repairs after the inspection, request a rate buydown or closing-cost help instead of assuming the seller will laugh, and you are not being pushed to skip the option period. For sellers, it means pricing to the year-to-date reality on day one matters more than it has in years, because the market is no longer bailing out an ambitious list price.
Where 78729 sits in the bigger picture
The wider market gives 78729 a helpful backdrop. Across the Austin-Round Rock-San Marcos metro, the August 2026 median came in around $412,000, down about 6.4 percent year over year, with sales down roughly 7 percent. Williamson County, where a good share of 78729 buyers also shop (the neighboring 78727 market update covers the Domain-adjacent side of this corridor), showed a median near $399,900, down about 5.9 percent, but with pending sales up more than 9 percent year over year. That last figure is the one worth watching: pending sales are a leading indicator, and a jump in pendings while prices are soft usually means buyers are quietly coming back in as affordability improves at the margins.
The affordability math still runs through the mortgage rate, and rates ticked up again recently. The Freddie Mac 30-year fixed averaged about 7.03 percent as of late September 2026, up from roughly 6.95 percent the week before. That matters more in 78729 than in the luxury zips, because buyers here are usually rate-sensitive and payment-driven rather than paying cash. A move of a quarter point changes the monthly payment enough to change which houses a buyer can afford, which is why the rate buydowns and points discussion has become central to almost every deal in this price band. I wrote a full breakdown of how points and buydowns actually pencil out, and it is worth reading before you lock. Talk to a lender about your specific numbers; this is general information, not personalized financial advice.
What buyers are actually getting in 78729
The reason 78729 holds its value is a combination that is hard to find elsewhere in Northwest Austin at this price: established neighborhoods with mature trees, Round Rock ISD schools, and a location that puts you inside the tech corridor rather than commuting into it. From most of 78729 you are minutes from the Parmer employers, a straightforward run to the Domain, and close to both US 183 and Parmer Lane for getting anywhere else in the metro.
The housing stock is mostly 1980s and 1990s construction. That is a feature and a caution at the same time. The feature is space and floor plans that families actually use, on lots that are bigger than what new construction offers at this price. The caution is that a house built in 1988 needs to be bought with its age in mind: original or aging roofs, HVAC systems near the end of their life, cast-iron or older plumbing in some homes, and the foundation movement that comes with Central Texas clay. None of that should scare you off. It should shape your inspection and your offer. A 78729 home that has had its roof, HVAC, and water heater replaced in the last several years is worth meaningfully more to you than an identical floor plan that has deferred all of it, and the list price does not always reflect that difference.
Within the zip, the sub-neighborhoods trade a little differently. Rattan Creek tends to command a modest premium for its amenities and its association identity. Milwood is the large, well-known core with a mix of sizes and a strong reputation among families. Hunters Chase and the Anderson Mill village pockets often come in a step lower, which is where the genuine value hunting happens. If you want to go deeper on the neighborhood-level differences, my Rattan Creek buyer guide covers what to check before you offer there specifically, and my rundown of where the value still is in the North Austin corridor under $500K maps out how 78729 stacks up against the nearby zips on price.
Schools: verify your exact address
78729 is primarily Round Rock ISD territory, and the schools are a real part of why families target it. But this is a zip where the district and campus assignment genuinely depends on the street, and in some pockets the feeder pattern splits. Do not assume the assignment from the zip code or even from the subdivision name. Before you write an offer, confirm the specific elementary, middle, and high school for that exact address directly with the district, and if schools are a top priority, make sure the pathway you want is the one that address actually feeds. This is the single most common thing buyers get wrong in this corridor, and it is completely avoidable with one verification step.
What this means if you are selling in 78729
If you own in 78729 and are thinking about selling, the market is on your side more than the headlines suggest, but only if you price and prepare to the current reality. The buyers are there. Pending sales in the county are rising, and homes in this price band are the ones that move because they are what most of the market can actually afford. What has changed is that you no longer get to price on hope. The year-to-date median and price-per-square-foot for your specific home type are the anchor, and a home priced 5 or 10 percent above that in the belief that the right buyer will overpay is the home that sits for two months and then cuts.
The homes winning right now are the ones that address exactly what buyers in this price band are nervous about: age and deferred maintenance. If your roof, HVAC, and major systems are recent, document it and put it front and center, because it is worth real money to a rate-stretched buyer. If they are not, decide before listing whether you are fixing, crediting, or pricing for it, rather than being surprised by it after the inspection. A partially updated home priced as though it is fully renovated is the most common overpricing mistake I see.
Is now a good time to buy in 78729?
For the right buyer, yes, and the reasoning is specific rather than cheerleading. You have inventory to choose from, time to do your due diligence, and negotiating room that did not exist three years ago. Prices are soft to flat rather than climbing, so you are not chasing a moving target. The offsetting factor is the rate: at about 7 percent, your monthly payment is higher than it would have been in the low-6s, and that is real. The way most 78729 buyers are handling it is by negotiating seller-paid rate buydowns or closing costs rather than waiting for a lower list price, and by planning to refinance if rates come down later while locking in the house and the price now. Whether that math works for you depends on your budget, your timeline, and how long you plan to stay, which is a conversation to have with your lender and your agent, not a decision to make off a blog post.
Frequently asked questions about the 78729 market
What is the median home price in 78729 right now?
The stable year-to-date median is about $450,000, at roughly $214 per square foot. The most recent single-month median was closer to $424,100, but in a zip this size a single month reflects which homes happened to close rather than a real price change, so the year-to-date figure is the better number to plan around.
Is 78729 a buyer's market or a seller's market in 2026?
It is close to balanced, tilting slightly toward buyers. With around 4.1 months of inventory and homes taking roughly 35 days to sell, buyers have time and negotiating room, while well-priced homes in good condition still sell in a reasonable window. It is neither the frenzy of 2021 nor a crash.
Why is 78729 cheaper than 78750 or 78759?
Price per square foot in 78729 runs around $214, versus roughly $290 in 78750 and well over $300 in 78759. The difference is age and address, not location quality. 78729 is mostly 1980s and 1990s homes without a prestige neighborhood name, which is precisely why it delivers more house and yard per dollar inside the same tech corridor.
What neighborhoods are in the 78729 zip code?
The main ones are Milwood, Rattan Creek, Hunters Chase, and the Village at Anderson Mill pockets, along with several smaller subdivisions. Rattan Creek often carries a modest premium for its amenities, while Hunters Chase and the Anderson Mill village areas tend to offer the best value.
What school district is 78729 in?
78729 is primarily Round Rock ISD, and the schools are a major draw for families. But campus assignment depends on the exact street, and some pockets feed different schools than neighbors assume. Always confirm the specific elementary, middle, and high school for the address with the district before you make an offer.
How do mortgage rates affect buying in 78729?
They affect it a lot, because buyers here are usually payment-driven rather than paying cash. With the 30-year fixed near 7 percent as of late September 2026, monthly payments are higher than they were in the low-6s. Most buyers are responding by negotiating seller-paid rate buydowns or closing costs rather than waiting for list prices to fall. Run your specific numbers with a lender.
Should I wait for prices or rates to drop before buying in 78729?
Prices in this corridor are soft to flat rather than falling sharply, so waiting for a big price drop may mean waiting a long time while competing with more buyers if rates ease. Rates are unpredictable and not something anyone can time reliably. The more useful question is whether the payment works for your budget today, whether you plan to stay long enough to ride out short-term swings, and whether a buydown gets you where you need to be. That is a personal calculation, not a market call.
The honest summary
78729 is doing what it has always done: quietly delivering the most house per dollar of any established, Round Rock ISD, inside-the-corridor zip in North Austin. The year-to-date median near $450,000 and price per square foot around $214 are the numbers to anchor on, not the noisier single month. The market is balanced and mildly buyer-favorable, with real negotiating room, and rising pending sales in the county suggest buyers are coming back as they get comfortable with rates near 7 percent. For buyers, the opportunity is inventory, time, and leverage, offset by the payment math you need to run with a lender. For sellers, the buyers are there, but the market will no longer reward an ambitious price, especially on a home that has deferred its big-ticket maintenance. As always, verify the school assignment for your exact address, and treat the rate and payment questions as a conversation with your lender rather than a decision made off a headline.
This is general market information, not personalized financial, tax, or investment advice. Figures are as of the data dates noted and change over time.
