What the 78759 Northwest Austin Housing Market Means for Buyers and Sellers (Mid-2026 Update)
If you are watching the 78759 market from the buyer or seller side right now, the honest one-line summary is this: it is a balanced market that has calmed down, not a market that has fallen apart. Homes in this part of Northwest Austin are still selling, they are just taking a normal amount of time to do it and closing at prices that have flattened rather than dropped off a cliff. That is a very different environment from 2021 and 2022, and it changes how you should play it whether you are buying or selling.
Here is what the most recent data actually says about 78759, the Balcones Woods, Great Hills, Mesa Park, and Balcones Hills corridor, and what it means in practice. A note up front: I am giving you general market information as a broker, not personalized financial advice, and the figures below are a snapshot from the most recent local report. Markets move, so treat this as a read on direction, not a guarantee for a specific home.
The 78759 numbers as of mid-2026
The figures here come from the ABoR and Texas Real Estate Research Center monthly local market report, zip detail, for July 2026, the most recent data available as of early September. In 78759 that month there were 38 closed sales, which is a healthy enough sample that the monthly figures actually mean something in this zip, unlike some of the smaller Northwest Austin zips where a handful of sales can swing the median wildly.
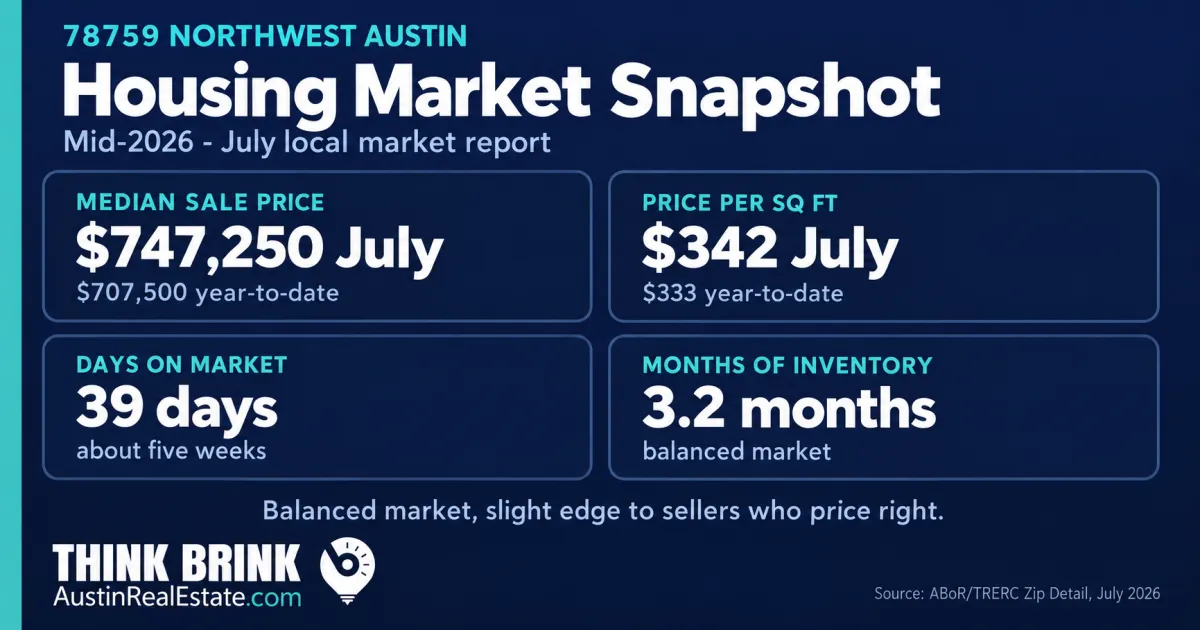
For July 2026 in 78759, the median sale price was $747,250, the median price per square foot was $342, the median days on market was 39, and there were 3.2 months of inventory. For a more stable read that smooths out month-to-month noise, the year-to-date median sits at $707,500 and the year-to-date price per square foot at $333.
The gap between the July median and the year-to-date median is worth understanding rather than glossing over. A single month running above the year-to-date pace usually reflects the mix of homes that happened to close that month, larger or more updated properties, plus normal summer seasonality, not a sudden jump in what every house is worth. When I am pricing or making an offer in 78759, I lean on the year-to-date figures and the price per square foot as the anchor, and treat a single month as directional. The takeaway is that 78759 is holding in the low-to-mid $700s on a stable basis, with a price per square foot in the low $330s to low $340s, which remains one of the stronger per-foot numbers among the established Northwest Austin zips.
What the days on market and inventory actually tell you
The two numbers I would pay the most attention to are days on market and months of inventory, because they describe the balance of power in the market better than the median price does.
A median of 39 days on market means a typical 78759 home is going under contract in a little over five weeks. That is neither the multiple-offers-in-a-weekend frenzy of a few years ago nor a stalled market where listings sit for a season. It is a normal, functional pace. Buyers have enough time to do their diligence and think, and sellers who price correctly are still finding a buyer in a reasonable window.
Months of inventory at 3.2 tells the same story from the supply side. Housing economists generally treat roughly six months of inventory as the dividing line between a buyer's market and a seller's market. At 3.2 months, 78759 still tilts modestly toward sellers on paper, but it is far from the sub-one-month conditions of the boom. In plain terms, there is enough supply that buyers have real choices and negotiating room, and not so much that well-presented, correctly priced homes struggle to sell. Balanced is the right word, with a slight edge still to sellers who do it right.
How 78759 sits against the wider Austin market
Context matters, because 78759 does not move in isolation. Across the broader Austin-Round Rock-San Marcos metro, the second quarter of 2026 showed a median sale price of about $438,900, down roughly 1.4 percent year over year, with homes taking around two months to sell and closing near 94 percent of their original list price. Travis County specifically ran a median around $515,000 for the quarter, essentially flat year over year. Through the summer, the metro pattern held: closed sales were running up year over year and prices were roughly flat, which is why the local reporting has described the market as stabilizing rather than sliding.
Set 78759 against that backdrop and the picture is clear. This zip trades at a meaningful premium to the county and metro medians, and its per-square-foot pricing in the low $330s to low $340s reflects the durable demand drivers here: the Round Rock ISD schools that many buyers target, the central location inside the 183 and MoPac and Loop 360 triangle, and the short commutes to the Domain and the Apple corridor. When the wider market flattens, established, well-located zips like 78759 tend to hold their value better than the outer suburbs, and that is roughly what the numbers are showing.
What this means if you are buying in 78759
You have more leverage than a buyer did three years ago, and less than headlines about a cooling market might lead you to expect. Use it accordingly.
With inventory around three months and homes taking five-plus weeks to sell, you generally have room to make a considered offer, ask for reasonable repairs after inspection, and negotiate rather than waive every protection to win. That is a real change from the frenzy years and it favors buyers who are prepared and decisive without being reckless.
The cost of money is the bigger constraint now. As of early September 2026, Freddie Mac put the 30-year fixed mortgage rate at about 6.71 percent, up slightly from the prior week and up from roughly 6.5 percent a year earlier, with the 15-year around 6.04 percent. In a $700,000-plus zip, the monthly payment math is driven more by the rate than by small swings in price, which is why it is worth understanding your financing options, including points, buydowns, and fixed versus adjustable structures, before you fixate on shaving a few thousand off the sale price. I walk through that tradeoff in detail in my guide to points, buydowns, and ARM versus fixed for Northwest Austin buyers.
One more buyer note specific to this zip: price per square foot is your friend here. Because 78759 mixes original-condition homes from the 1970s and 1980s with heavily updated ones, the median price alone hides a wide range. Comparing homes on a per-foot basis, adjusted for condition and updates, will tell you far more about whether a given listing is priced fairly than the neighborhood median will.
What this means if you are selling in 78759
The market is still working for sellers who price to current data and present the home well. It is not working for sellers who anchor to a 2022 number and wait for the phone to ring.
At roughly 94 percent of original list price across the metro and a five-week median time to sell, the message is that correctly priced homes are closing close to ask, while overpriced ones sit, accumulate days on market, and eventually sell for less after a price cut than they would have by pricing right out of the gate. The single most valuable thing you can do is price against the year-to-date 78759 figures and the true per-foot comps for your home's condition, not against what a neighbor listed at last year or what your home might have fetched at the peak.
Presentation still earns money at this price point. Buyers in 78759 are often relocating tech professionals and dual-income households who are comparing your home directly against updated competition. Clean, staged, well-photographed homes in move-in condition are the ones capturing the five-week sale and the near-list price. If waiting for a better market has been your plan, it is worth being honest about what that wait costs in carrying expenses, a theme I cover in what Northwest Austin sellers get wrong about timing.
The neighborhoods behind the zip
A zip code median blends very different neighborhoods, and 78759 is no exception. Balcones Woods consistently posts some of the fastest sale times of any established neighborhood in the zip, on the strength of its central location and relative value. Great Hills spans a wide price range from entry-level condos and townhomes to substantial homes near the country club and the Arboretum. Mesa Park and Balcones Hills offer established, walkable pockets with strong school access. Each behaves a little differently within the overall zip trend, so the right move is to look at your specific neighborhood and street, not just the 78759 average. If you want the fuller picture of the area and its neighborhoods, start with my pillar guide to living in 78750 and 78759 and the deeper dive on what buyers should know about Balcones Woods.
Frequently asked questions
Is 78759 a buyer's market or a seller's market right now?
As of the July 2026 data it is best described as balanced with a slight edge to sellers. Months of inventory around 3.2 is below the roughly six months that would signal a true buyer's market, but it is high enough that buyers have real choices and negotiating room. Correctly priced homes still sell in about five weeks.
What is the median home price in 78759?
In the July 2026 report the median sale price was $747,250, with a more stable year-to-date median of $707,500. The year-to-date figure is the better number to quote as the underlying level, since a single month can run above or below trend depending on which homes closed.
How long does it take to sell a home in 78759?
The median time on market in the July 2026 data was 39 days, a little over five weeks. That is a normal, functional pace, and homes that are priced to current comps and presented well tend to land in that window while overpriced listings take longer.
Are home prices in 78759 falling?
Not meaningfully. The pattern across the Austin metro through 2026 has been prices roughly flat to modestly down year over year while sales volume rose, and established, well-located zips like 78759 have held up better than the outer suburbs. Call it a plateau after the boom rather than a decline.
Why is 78759 more expensive than the Austin metro median?
The metro median sits in the mid-$400,000s while 78759 runs in the low-to-mid $700,000s. The premium reflects sought-after Round Rock ISD schools, a central location inside the 183, MoPac, and Loop 360 triangle, and short commutes to the Domain and the Apple corridor. Demand for that combination stays strong even when the wider market softens.
How much are mortgage rates affecting buyers here?
A lot, because at this price point the monthly payment is driven more by the interest rate than by small price differences. As of early September 2026 the 30-year fixed averaged about 6.71 percent. That makes financing strategy, including points and buydowns, at least as important as negotiating the sale price. Talk to a lender early, and treat any rate figure as a moving target.
Should I wait for prices or rates to drop before buying or selling?
That is a personal decision, and I am not going to give you a market-timing guarantee, because nobody can. What the current data supports is that this is a normal, functional market in 78759 where prepared buyers and correctly priced sellers are both transacting successfully. Waiting has real costs on both sides, and trying to time the bottom or the peak rarely beats acting when the move makes sense for your own situation.
What this means for you
The 78759 market in the second half of 2026 is stable and functional. Prices have plateaued in the low-to-mid $700,000s, homes are selling in about five weeks, inventory sits around three months, and the whole thing tilts just slightly toward sellers who do it right. The frenzy is gone and so is the fear. For buyers, that means real negotiating room paired with a higher cost of money, so financing strategy matters as much as price. For sellers, it means the market rewards accurate pricing and strong presentation and punishes waiting for a number that has already passed.
If you want a read on your specific home or a specific listing in 78759 rather than the zip-wide average, that is exactly the kind of thing I do for clients here every week. Reach out and we can look at the real comps for your street and condition. For the money and timing pieces of the decision, a lender and, where taxes are involved, a CPA can give you advice specific to your numbers.
Market figures in this article are a snapshot from the July 2026 ABoR and Texas Real Estate Research Center local market report and the Freddie Mac rate survey as of early September 2026, and they will change over time. This is general market information, not personalized financial, investment, or lending advice.
