What Happens to Your Equity When You Wait Too Long to Sell in Northwest Austin
There is a version of holding onto a home in 78750 or 78759 that makes complete financial sense. You're using the space, the carrying costs are manageable relative to your income and situation, the home fits your life, and staying put is genuinely the right call. That's not what this post is about.
This post is about the other version - the one where the home has quietly become more of a financial obligation than a financial asset, where the equity sitting in the walls is substantial and largely idle, and where the decision to wait for a better moment to sell has been renewed so many times that it's become the default rather than a conscious choice.
If you've been in that situation for one or two or three years, this is a clear-eyed look at what that waiting has actually cost you and what it continues to cost you each month you stay.
What Northwest Austin Sellers Get Wrong About Timing the Market
The Equity Picture: What Longtime 78750 and 78759 Owners Are Actually Sitting On
Start with the asset itself. The FHFA House Price Index shows that established Northwest Austin neighborhoods appreciated approximately 78% from 2018 to 2025 - and that figure captures the run-up through 2022 and the subsequent correction. A home purchased in 78750 or 78759 in the early 2000s for $280,000 to $350,000 is worth somewhere between $550,000 and $800,000 or more today depending on size, lot, condition, and school assignment. A home purchased in the mid-2000s for $375,000 to $450,000 has experienced similar appreciation curves.
For a seller who purchased in 2002 for $300,000 and owns a home currently worth $680,000 with a paid-off mortgage, the equity position is approximately $680,000 minus transaction costs. After 8% to 10% in selling costs - broker commissions, title, escrow, pre-listing preparation - the net proceeds are in the $610,000 to $625,000 range. For most longtime owners in these zip codes, that is the single largest financial asset they own.
Now ask what that asset is doing right now. Not in an abstract investment sense - in a concrete, month-by-month sense.
What the Equity Is Not Doing
The $610,000 in net equity sitting in a paid-off 78750 or 78759 home is not generating income. It is not diversified across asset classes. It is not liquid. It cannot be deployed quickly in response to an opportunity or a need. It grows when the local real estate market grows and declines when the local real estate market declines - on a schedule and at a rate that the homeowner does not control.
For comparison: $610,000 in a low-risk investment portfolio generating a 4% to 5% annual return produces $24,400 to $30,500 per year in income. In a higher-performing diversified portfolio that historically returns 7% to 8%, it produces $42,700 to $48,800 per year.
That is not a recommendation to sell and invest in the market - it's a way of making concrete what the opportunity cost of holding an illiquid asset actually looks like in numbers rather than abstractions. The equity in your home has a value. That value is being deployed in a specific way - sitting in a home - rather than in alternative ways. Understanding that cost is part of making a conscious decision about whether to stay or go.
Five Signs It May Be Time to Sell Your Northwest Austin Home
The Carrying Cost: What Waiting Actually Costs Month to Month
This is the number most sellers have never calculated precisely, and seeing it clearly changes the conversation about waiting.
On a representative $680,000 home in 78750 or 78759 with the standard homestead exemption:
Property taxes at a combined rate of approximately 2.05%: roughly $11,000 to $12,500 per year depending on specific assessment and exemptions.
Homeowner's insurance in the current Texas market: $3,500 to $5,500 per year for a home of this age and value, reflecting the meaningful rate increases Texas homeowners have absorbed over the past three years.
Maintenance averaged over time at 2% of home value for a 30-to-40-year-old home: approximately $13,600 per year. Some years lower, some significantly higher, but averaged across HVAC replacements, roof cycles, pool equipment, irrigation repairs, and the steady accumulation of deferred items that older homes generate.
HOA dues if applicable: $400 to $1,200 per year.
Total annual carrying cost: approximately $28,500 to $32,800 per year, or $2,375 to $2,733 per month.
If there is a remaining mortgage on the property, add that on top. If you refinanced in 2018 or 2019 and still have a balance of $150,000 at 4.5%, add another $820 per month in principal and interest - of which a meaningful portion is interest rather than equity building.
That is what staying costs. Not in some abstract accounting sense, but in real dollars leaving your account every month in the form of tax bills, insurance premiums, maintenance expenses, and HOA dues.
The Appreciation Math: What the Market Has to Do for Waiting to Win
Here is where the waiting calculation gets specific and, for most sellers in this situation, uncomfortable.
For waiting to make financial sense - for the market appreciation you'd capture by staying to exceed the carrying cost you're absorbing by staying - the market needs to appreciate at a rate that outpaces your annual carrying cost.
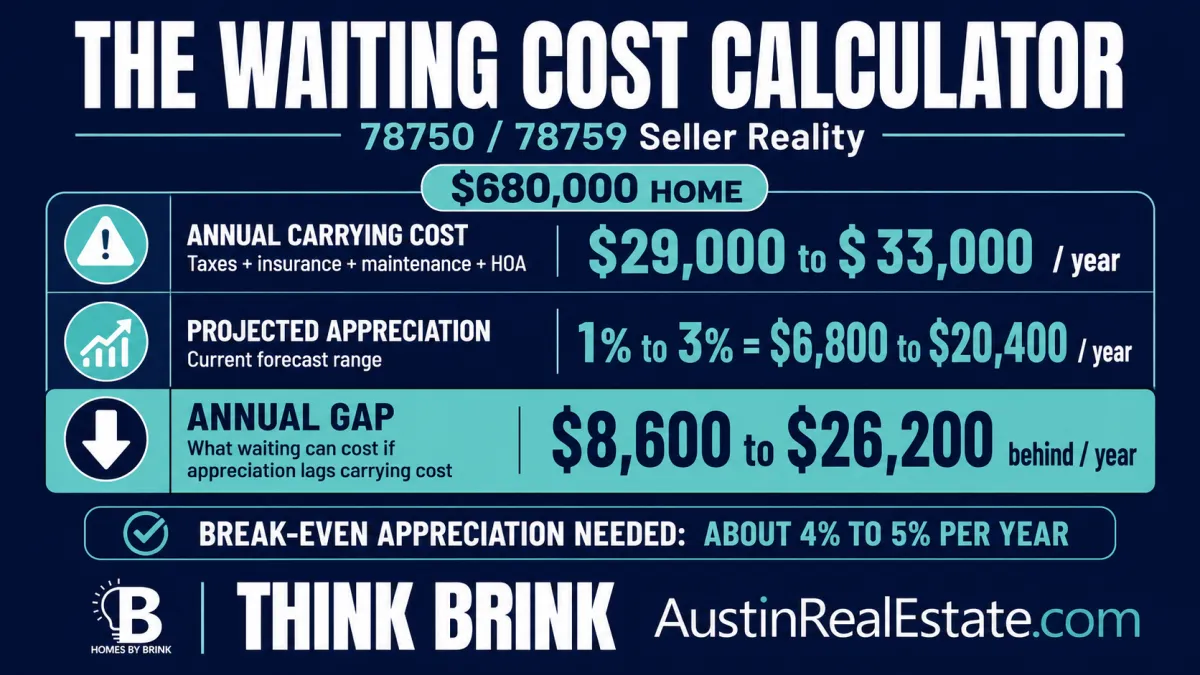
On a $680,000 home with $29,000 to $33,000 in annual carrying costs, the market would need to appreciate at roughly 4.3% to 4.9% per year for waiting to break even with selling now. Appreciation above that rate means waiting is winning. Appreciation below that rate means every month you wait, you're paying to stay in a home that isn't keeping pace with what it's costing you.
Current forecasts for the Austin market from major sources are calling for 1% to 3% annual appreciation through 2026 and into 2027. Most are not calling for a return to the 8% to 12% annual appreciation rates that characterized the 2019 to 2022 period on any near-term horizon. The market would need to appreciate at 5% to 7% annually for waiting to clearly win against carrying costs on a home in this price range - and that is not what the consensus forecast is showing.
The math of waiting, applied to the specific carrying costs of a 78750 or 78759 home at current price levels, consistently produces outcomes that favor selling over waiting in most scenarios where the seller has flexibility and the home has meaningfully exceeded its usefulness for their current life situation.
How to Choose the Right Listing Agent for Your 78750 or 78759 Home
What Three Years of Waiting Has Looked Like
For sellers who have been holding since 2022 or 2023 with the intention of waiting for the market to recover, the concrete picture of what that wait has cost is worth running specifically.
Assume a $680,000 home with $30,000 in annual carrying costs. Three years of holding equals $90,000 in carrying costs that went out the door while you waited. In that same period, Austin's overall market has not recovered to 2022 peak values - it has softened further in most metrics, with the metro down approximately 12% to 15% from peak. The home you were planning to sell for $750,000 in 2022 has not recovered to that value and may not in the near term.
The seller who waited three years hoping to recover 2022 values has paid $90,000 in carrying costs and is still holding a home that is worth less than it was at peak. The seller who adjusted expectations, priced to the 2023 or 2024 market, and sold - even at $50,000 to $75,000 below the 2022 peak - saved the carrying costs and deployed the equity into something that has either grown or at minimum stayed liquid and available.
This is not to say the 2022 seller made a mistake - no one could have predicted with certainty how the Austin market would move. It's to say that the decision to wait has a cost, and that cost needs to be explicitly calculated rather than assumed to be neutral.
The Compounding Problem: What Happens to a Home That Waits Too Long
There is a specific deterioration pattern that affects homes in 78750 and 78759 that have been held beyond the point where the owners are fully investing in maintenance and updates. It's gradual enough that it doesn't feel dramatic while it's happening, but it shows up clearly in how buyers respond when the home finally does come to market.
The roof that needed attention three years ago and got patched instead of replaced is now at the end of its reliable life and visible to any inspector. The HVAC that was aging in 2023 has now officially been replaced twice before and is running on its final cycle. The kitchen that was dated when buyers were looking in 2022 is now four years more dated and competes against homes that renovated in the intervening period. The exterior paint that needed refreshing has now weathered another three Austin summers. The pool equipment that was marginal has now become a negotiating point in every offer.
Each of these items is manageable individually. Together, they represent a compounding of deferred decisions that narrows the buyer pool, increases inspection negotiation risk, and reduces net proceeds - often by more than the carrying cost savings from delaying the transaction.
The homes in 78750 and 78759 that are coming to market after sitting on the sidelines for two or three years frequently arrive in a condition that is meaningfully worse than they were when the decision to wait was originally made. The sellers receive less for them than they would have in the year they originally considered selling, having paid two or three years of carrying costs in the interim.
What It Actually Costs to Own a Home in 78750 or 78759 Right Now
The Reinvestment Question: What the Equity Could Be Doing Instead
This is the conversation that most sellers in this situation haven't had clearly with themselves, and it's the one that changes the calculus most significantly when they do.
If you sold your 78750 or 78759 home today and netted $550,000 to $620,000 after transaction costs, what would you do with that money?
For a seller moving to a smaller home - a one-story patio home, a townhome, a lower-maintenance property priced in the $350,000 to $450,000 range - the net proceeds cover the next purchase outright or with a very small mortgage. The carrying cost on the next home is $12,000 to $18,000 per year rather than $29,000 to $33,000. The annual savings of $11,000 to $15,000 per year is real money that goes toward whatever matters to you rather than toward maintaining a home you may have outgrown.
For a seller moving to a rental or a different ownership structure, the net proceeds represent a liquid asset that can be invested, deployed toward retirement income, or simply held in a form that is accessible rather than locked in the walls of a specific house in a specific zip code.
For a seller who has no immediate plan for the next home, the proceeds represent flexibility. The ability to move when the right opportunity appears, to rent for a year while looking for the specific property that actually fits the next chapter, to make a cash offer on something that comes available rather than waiting for contingencies to clear.
None of those options are available while the equity sits in the current home. The equity in your 78750 or 78759 home is real and substantial. What it isn't is doing anything for you right now except covering the cost of the home that contains it.
The Moment That Usually Clarifies the Decision
Sellers who have been in the waiting pattern for two or three years frequently describe a specific moment when the calculation became clear rather than foggy. It's not usually a dramatic market event or a financial crisis. It's usually something quieter.
It's the second significant repair in twelve months that costs more than expected and feels like the home is finally asking for more than you're willing to give it. It's the conversation with a financial advisor who runs the equity deployment numbers and makes the opportunity cost concrete rather than abstract. It's the friend who downsized two years ago and describes their daily life in a way that sounds better than what you're living in your current home. It's the moment you add up what you've spent on maintenance in the past three years and realize the number is close to what a full year of carrying costs would have been if you'd sold when you first started thinking about it.
Those moments don't create the decision - they clarify a decision that has been building for a while. The decision itself is personal, shaped by your specific financial situation, your specific next home vision, and your specific readiness to move through the process of selling and transitioning.
But the financial case for staying in a home in 78750 or 78759 that has passed its useful purpose for your current life - while absorbing $29,000 to $33,000 per year in carrying costs on an equity position that isn't growing fast enough to justify those costs - is not a strong one. And the longer that situation continues, the more it costs.
What Is Your 78750 or 78759 Home Worth Right Now?
The Practical Question Worth Answering Now
If you've read this far and found yourself recognizing the situation more than you expected to, the most useful next step is not a decision. It's a number.
Find out what your home is actually worth in the current market - not your TCAD value, not your Zestimate, not what you assume it is. Get an actual current market value estimate based on what comparable homes have closed for in the past 90 days in your specific neighborhood with your specific school assignment and your specific condition level.
Then run your carrying cost. Property taxes, insurance, maintenance averaged over time. Put it in a single annual number.
Then divide the carrying cost by the home value and calculate what percentage appreciation the market needs to produce each year for waiting to break even. Compare that to what forecasters are actually projecting for the Austin market.
That math - done with your specific numbers rather than hypothetical ones - is the clearest answer to the question of whether waiting is working for you or working against you.
What Sellers in 78750 and 78759 Should Know About the Market Right Now
Frequently Asked Questions
How much equity do typical longtime owners in 78750 and 78759 have right now?
It depends on when they purchased and what they've paid down, but longtime owners who purchased in the late 1990s through mid-2000s in these zip codes typically have net equity in the $400,000 to $650,000 range after transaction costs, reflecting the substantial appreciation these zip codes have experienced since that era. The FHFA data shows established Northwest Austin neighborhoods appreciated approximately 78% from 2018 to 2025 alone.
What does it cost to hold a $680,000 home in 78750 or 78759 for a year without selling?
The combined annual carrying cost - property taxes, homeowner's insurance, maintenance averaged over time, and HOA dues if applicable - runs approximately $28,500 to $32,800 per year on a representative $680,000 home in these zip codes. That's roughly $2,375 to $2,733 per month, before any remaining mortgage payment.
How much does the market need to appreciate for waiting to make financial sense?
For a home in this price range with these carrying costs, the market needs to appreciate approximately 4% to 5% per year for waiting to break even - meaning appreciation covers carrying costs without a net loss from staying. Current mainstream forecasts for Austin project 1% to 3% annual appreciation through 2026 and into 2027. The market would need to run 5% to 7% appreciation for waiting to clearly win against carrying costs, and that is not what most forecasts are projecting.
Is it true that the Austin market might recover significantly if rates drop?
A rate decrease would expand the buyer pool and could support price increases. However, when rates drop and buyers return to the market, sellers return too - and the listings that have been held back tend to come to market simultaneously, increasing competition among sellers. Getting ahead of a recovery - listing before the surge of competing inventory arrives - is historically more effective than waiting to sell into a crowded post-recovery market.
What happens to a home's condition while it's waiting to be sold?
Homes in 78750 and 78759 that have been held beyond the point of full investment in maintenance accumulate deferred items that compound over time - aging systems, dated finishes that fall further behind market expectations, and deferred repairs that become inspection negotiation points. Homes that come to market after two or three years of partial maintenance frequently receive less than they would have received when the decision to wait was originally made.
What would my equity actually do if I sold and moved to a smaller home?
The most common scenario for longtime 78750 and 78759 owners is a transition to a smaller home priced in the $350,000 to $500,000 range. Net proceeds from the current sale typically cover the next purchase outright or with a very small mortgage. Annual carrying costs on the next home run approximately $12,000 to $18,000 - saving $11,000 to $15,000 per year compared to the current home. The equity that was sitting illiquid in the current home becomes either the purchase price of the next one or a combination of that plus liquid savings.
