What the 78750 Northwest Austin Housing Market Means for Buyers and Sellers (2026 Update)
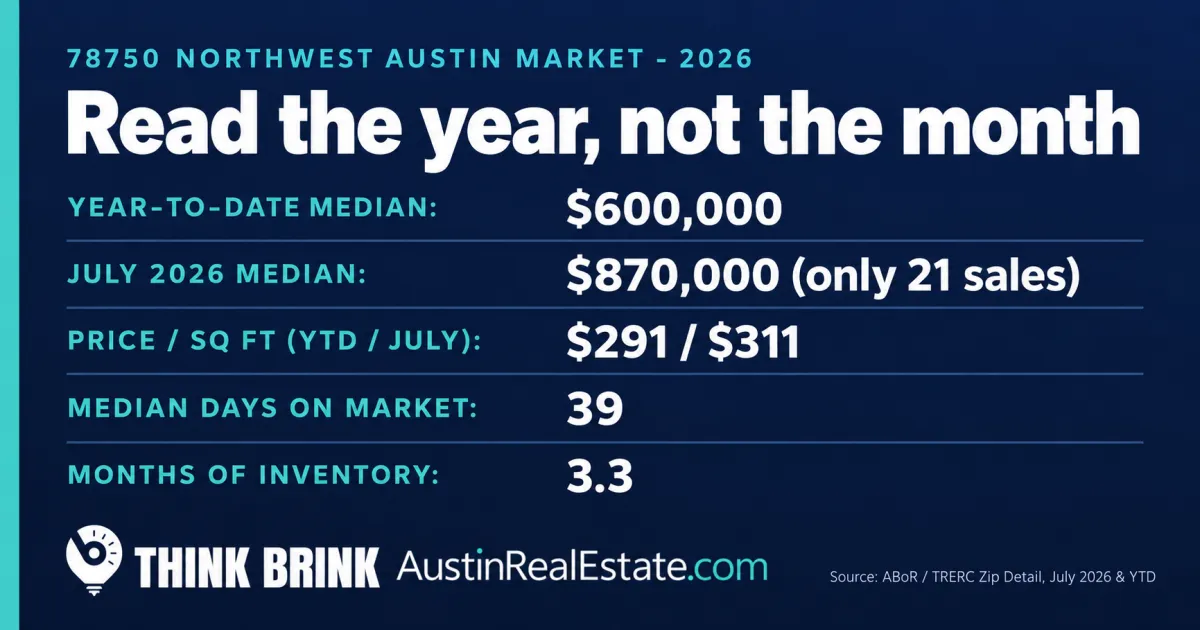
If you are buying or selling in 78750 right now, the first thing to understand is that this is not a zip code you can read from a single month of data. In July 2026, the median sale price in 78750 was $870,000. The year-to-date median was $600,000. Those two numbers describe the same zip code in the same year, and the gap between them is the most important thing on this page. It is not a crash and it is not a boom. It is what happens when a small, high-variety zip code closes only about two dozen sales in a month and the mix of what sold swings the median around.
78750 covers Spicewood Estates, Balcones Village and the Balcones Country Club area, and Jester (Jester Estates and Jester Point), plus the established streets around them in far Northwest Austin. It is one of the more varied zip codes in my footprint: you can buy an updated single-story on a normal interior lot, and you can buy a hillside or golf-frontage home well over a million dollars, sometimes on the same week. When a month happens to include more of the second kind, the median jumps. That is exactly what the July figure reflects, and it is why I lead with the year-to-date number instead.
What the 78750 numbers actually say
Here is the July 2026 data for 78750, drawn from the ABoR and Texas Real Estate Research Center monthly local market report, zip detail. Read it as a snapshot, not a trend line.
- Closed sales in July: 21. That is a small sample. In any zip that closes around 20 to 25 homes in a month, a single expensive or unusually cheap sale moves the median noticeably. Treat one month as directional at best.
- July median sale price: $870,000 (about $880,000 for single-family only). High, and heavily influenced by which homes happened to close.
- Year-to-date median sale price: $600,000. This is the stable number. It pools far more sales and is the figure I would quote if someone asked me what a typical 78750 home is trading for in 2026.
- July median price per square foot: $311; year-to-date price per square foot: $291. Price per square foot is less jumpy than the median because it partly adjusts for home size, so the gap here is smaller and more believable than the gap in the medians.
- July median days on market: 39. Homes are taking roughly five to six weeks to go under contract on average, not days.
- July months of inventory: 3.3. Around three to four months of supply is a balanced-to-mildly-seller-favorable market, not the frenzy of 2021 and 2022 and not a buyer's fire sale either.
If you take one thing from the data, take this: the honest read on 78750 in 2026 is a home price in the low-to-mid $600,000s as the typical trade, homes selling in a little over a month, and enough supply that buyers have room to inspect, negotiate and walk if the deal is wrong. The $870,000 July median is real, but it is a statement about July's mix, not about where the market has moved.
Why the single-month median is misleading here, and what to use instead
This matters because it is exactly the number sellers and buyers get burned on. A seller who reads "the July median in 78750 was $870,000" and prices a mid-tier home to that figure will sit. A buyer who reads the year-to-date $600,000 and assumes every home in 78750 trades there will be shocked by what a Balcones Village golf-frontage home or a Jester Point hillside house actually costs. Both are misreading a wide zip code through one number.
The tools that hold up in a low-volume zip are the year-to-date median and price per square foot, plus the days-on-market and months-of-inventory figures for the current month, which tell you about pace and leverage rather than price level. For the price of your specific home, the only thing that works is a comparable-sales analysis of homes like yours, in your section, in your condition tier. That is not a slogan. In a zip that runs from established interior lots to million-dollar hillside homes, the zip-wide median is a starting point for a conversation, not an answer. My post on what your 78750 or 78759 home is worth right now walks through how condition tier and section change the number.
What 78750 actually is, and why the range is so wide
Three established communities anchor the zip. Spicewood Estates sits in the wooded hills off Spicewood Springs Road, with larger lots and a mix of original and updated homes. Balcones Village wraps the Balcones Country Club and its golf courses, where frontage and view lots carry a real premium over interior streets. Jester, up on the hill off Highway 2222, includes Jester Estates and Jester Point and has its own club with pool and tennis. Around and between them are the older established streets that make up the rest of the zip.
Schools are a major reason buyers target 78750, and they are also a reason to verify by address rather than by zip. Much of the zip feeds the Round Rock ISD pathway that includes Spicewood Elementary, Canyon Vista Middle School and Westwood High School, an International Baccalaureate World School and one of the most sought-after feeders in my geography. But 78750 is not uniform, and boundaries do not follow the zip line. Confirm the exact campus assignment for any specific address with the district before you fall in love with a house for its schools.
The practical takeaway for reading the market here: the "typical" 78750 home and the "premium" 78750 home are genuinely different products. When you compare listings, compare like with like. A view or golf lot, a larger house, and a fully updated interior all command more, and they are the homes most likely to pull a monthly median upward when several close together.
The rate backdrop, and what it does to the monthly payment
Mortgage rates are the other half of what buyers actually feel. As of mid-September 2026, Freddie Mac put the average 30-year fixed rate at 6.95%, up from roughly 6.26% a year earlier. Rates have drifted up over the late summer, not down. That matters more in 78750 than in a cheaper zip, because the loan sizes here are larger, so each quarter-point of rate is a bigger swing in the monthly payment.
This is the quiet reason the pace has normalized. Homes still sell, but at around five to six weeks on market and with three-plus months of supply, buyers are not being forced to waive everything and overbid the way they were a few years ago. If you are financing, talk to a lender about whether a rate buydown or points make sense for your situation before you assume the sticker payment is the payment. I am a broker, not a lender or a financial advisor, so treat rate strategy as a conversation to have with a licensed professional, not advice from a blog.
What this means if you are buying in 78750
You have more room than buyers did in the boom, and you should use it. Three to four months of inventory and a five-to-six-week average time on market means most homes are not drawing instant multiple offers, so you generally have time to get a proper inspection, ask for repairs or credits, and negotiate on price and terms. That leverage is real, but it is uneven. A well-priced, updated home in a strong section can still move quickly and draw competition, while an overpriced or dated home can sit for months. Read each listing on its own merits and its own days on market, not on the zip-wide average.
Do not anchor to the $870,000 July median or the $600,000 year-to-date median as if either is "the price." Get a comparable analysis for the specific section and condition tier you are shopping. And decide early whether you are buying the typical 78750 home or the premium one, because they are different budgets and different negotiations.
What this means if you are selling in 78750
Price to your comparables, not to the highest number you saw in a headline. The single most common way sellers lose money in a zip like this is anchoring to a volatile monthly median that happened to be high, listing above the market, and then chasing it down with price cuts while the days-on-market clock runs. Buyers read days on market, and a home that has sat looks like a problem even when it is only mispriced.
The market is still reasonably balanced in your favor, with supply on the lower side of normal, but it is a market that rewards accurate pricing and real preparation, not optimism. If your home is updated and shows well, you can expect it to trade in a normal window at a fair number. If it is dated or priced on hope, expect it to sit. My post on what Northwest Austin sellers get wrong about timing covers the cost of waiting and mispricing in more detail, and the broader Living in 78750 and 78759 guide puts the zip in context against its neighbors.
How 78750 compares to the wider market
For context, not for pricing: across the Austin-Round Rock-San Marcos metro, prices have been essentially flat to modestly down over the past year, with sales volume soft and homes selling at roughly 94% of original list price after about two months on market. The most recent metro reporting through late summer 2026 showed the area-wide median in the low $400,000s and closed sales down year over year, with pending sales holding up. That is a normalized, mildly buyer-favorable backdrop across the region.
78750 sits well above the metro median because it is an established, amenity-rich, strong-schools zip in Northwest Austin, not a cross-section of the whole metro. Use the metro figures to understand the direction and the mood, which is steady and unhurried, and use the 78750 year-to-date figures to understand the level. Do not mix the two. A companion look at the neighboring zip is in my 78759 market update.
Frequently asked questions
What is the median home price in 78750 in 2026?
The year-to-date median in 78750 for 2026 is about $600,000, which is the figure I would use for a typical home. A single month can read very differently: July 2026 came in at $870,000 on only 21 sales, which reflects that month's mix of higher-end homes more than a real move in prices. Use the year-to-date number for the level and treat any single month as directional.
Why is the July median so much higher than the year-to-date median?
Because 78750 is a low-volume, high-variety zip. With roughly 20 to 25 sales in a month, a handful of expensive Balcones Village golf-frontage or Jester hillside homes closing together will pull the median sharply upward. The year-to-date median pools far more sales, so it is the more reliable read.
Is 78750 a buyer's market or a seller's market right now?
It is roughly balanced, tilting mildly toward sellers on supply. Around 3.3 months of inventory and a median of 39 days on market in July point to a normalized market: homes sell in about five to six weeks, buyers have room to inspect and negotiate, and sellers still hold a modest edge if they price accurately. It is not the frenzied seller's market of 2021 and 2022.
How long are homes taking to sell in 78750?
The July 2026 median was 39 days on market, so a little over a month is typical. Well-priced, updated homes can go faster and occasionally draw competition; overpriced or dated homes can sit considerably longer. Read each listing's own days on market rather than assuming the average applies to every house.
What schools does 78750 feed?
Much of 78750 feeds the Round Rock ISD pathway of Spicewood Elementary, Canyon Vista Middle School and Westwood High School, an IB World School and one of the strongest feeders in Northwest Austin. The zip is not uniform, and boundaries do not follow the zip line, so verify the exact assignment for any specific address directly with the district before making a decision based on schools.
Are prices in 78750 going up or down?
Neither sharply. The metro backdrop over the past year has been flat to modestly down, and 78750 looks consistent with that: normalized pace, balanced supply, and prices holding rather than surging or falling. The volatility you see month to month in this zip is mostly the small-sample effect, not a trend. For your specific home, a comparable-sales analysis will tell you far more than the zip-wide direction.
How much home does the price per square foot suggest?
Year-to-date price per square foot in 78750 is about $291, with July at $311. Price per square foot is steadier than the median because it partly accounts for home size, so it is a useful cross-check. But it still varies a lot by section, lot type, and condition, so use it as a sanity check alongside real comparables, not as a formula.
Does the higher mortgage rate change what I can afford here?
It can, because loan sizes in 78750 are larger than in cheaper zips, so each move in rate is a bigger dollar swing in the monthly payment. With the 30-year fixed averaging around 6.95% in mid-September 2026, up from about 6.26% a year earlier, it is worth talking to a lender about buydowns or points before you assume the payment. I am a broker, not a lender or financial advisor, so treat that as a professional conversation, not advice from this page.
What this means for you
78750 in 2026 is a steady, established Northwest Austin market that you have to read carefully because its own data is noisy. The typical home is trading in the low-to-mid $600,000s year to date, homes are selling in a little over a month, and there is enough supply that buyers have leverage and sellers have to price honestly. The eye-catching $870,000 July median is a small-sample artifact, not a signal to price your home there or to panic that you have been shut out.
If you are weighing a move in 78750, whether buying, selling, or downsizing out of a longtime home here, the right next step is a real comparable analysis for your specific section and condition, not a zip-wide average. If you want that, I am glad to put it together.
The figures here reflect ABoR and Texas Real Estate Research Center zip-level data for July 2026 and year-to-date, plus publicly reported metro and mortgage-rate figures as of mid-September 2026. Market data changes; confirm current figures before acting. This is general market information, not personalized financial, lending, or investment advice.
